Doc's note: Let me introduce you to a guy who recently beat out hundreds of investors... including top hedge fund managers, institutional traders, and billionaire investors.
For example, the founder of Greenlight Capital, David Einhorn, had a portfolio that rallied 122%... Mark Yusko – who manages some $1.5 billion at Morgan Creek Capital Management – barely edged him out and posted a 123% performance...
But Eric Fry, an international finance expert and former hedge fund manager,blew them away... He posted 150% gains.
Below, I'm featuring an essay from Eric about an approach he used to take first place in Wall Street's most prestigious investment competition...

If you're hoping to find the very best investment opportunities for the next three to five years, you won't find them in the S&P 500 Index or the Dow Jones Industrial Average.
You're looking in the wrong place.
Most U.S. stocks have enjoyed a fantastic eight-year run from their 2009 lows. But as a result of this success, they've become expensive relative to competing investment opportunities around the globe.
Most of today's best opportunities lie in overseas markets or in certain pockets of the natural resources market.
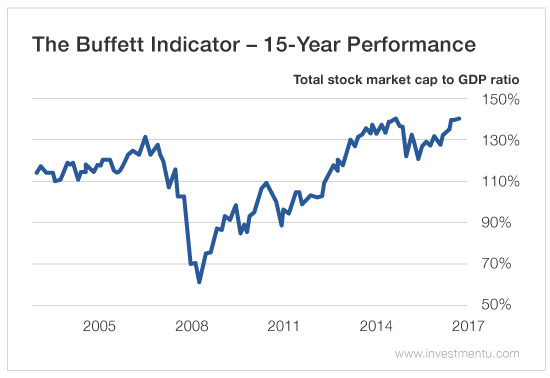
To see why, look at the chart below. It shows the total market value ("market cap") of all U.S. stocks expressed as a percentage of U.S. gross domestic product (GDP).
This calculation is called the "Buffett Indicator." And right now, it's telling us that U.S. stocks are expensive... very, very expensive.
To be clear, Mr. Buffett didn't invent this valuation gauge... he merely offered it public praise.
Back in a 2001 interview with Fortune magazine, Buffett lauded this indicator as the "the best single measure of where valuations stand at any given moment." It's been called the Buffett Indicator ever since.
But here's why it matters today...
According to this valuation gauge, a stock market is relatively cheap when its market cap drops below 100% of GDP. Conversely, a stock market is relativelyexpensive when its market cap climbs above 100% of GDP.
Today, the U.S. market cap totals a whopping 142% of GDP. That's more than double the average readings of the last 65 years. It's also the second-highest level this metric has ever reached during the last 65 years.
If you need another reason to lighten up on U.S. stocks, consider this next chart...
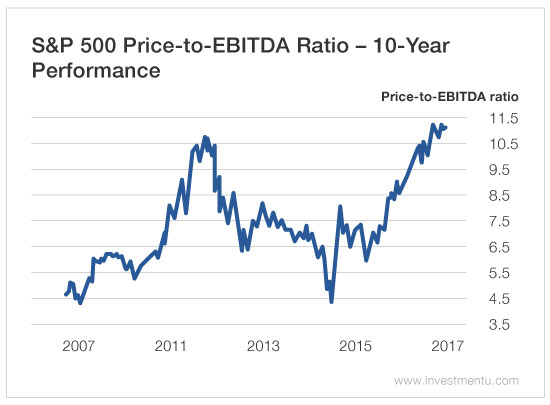
What does it show? It shows the S&P 500's incredibly rich price-to-cash-flow ratio... which just soared past the extreme reading it hit in 1999, right before stocks tumbled into the deep bear market of 2000 to 2003.
(In this chart, "cash flow," is represented by "EBITDA" – or earnings before interest, taxes, depreciation and amortization – a profitability metric that eliminates the impact of accounting tricks.)
Taken together, the Buffett Indicator and the S&P 500's lofty price-to-cash-flow ratio both suggest that the U.S. stock market has "decoupled" from underlying economic trends.
In our industry, this sort of decoupling is called "multiple expansion" – a process that enables share prices to soar, even when the underlying economy isn't doing much of anything.
Stock prices rise because investors become willing to pay ever-higher prices for each dollar of earnings or cash flow.
So, for example, instead of paying $7 for every dollar of a particular stock's annual cash flow... investors decide to pay $8 per dollar of cash flow, then $9, then $10, etc.
Multiple expansion is fun while it lasts. It makes stocks go up. But there is a dark side to extreme multiple expansion...
It often precedes its evil twin, multiple contraction.
Investors can decide to pay lower multiples just as easily as they can decide to pay higher multiples – especially if a selling panic takes hold.
That's why multiple expansion is one of the flimsiest of all stock market foundations... and why it's usually a good idea to tiptoe away from multiple-expanded markets.
Imagine, for example, if the U.S. stock market reverted to its average...
If the S&P 500 fell to its average price-to-cash flow ratio of the last 37 years, it would drop more than 30%.
But the Buffett Indicator presents an even scarier prospect...
If U.S. stocks were to return to their average Buffett Indicator readings of the last 65 years, they would plummet more than 50%!
Bottom line? Buying your average S&P 500 U.S. stocks now is a bit like buying a quart of milk three days before its expiration date.
They'll probably be OK for a little longer, but they're likely to sour quickly.
Good investing,
Eric
Doc's note: Eric recently identified three specific sectors that have entered theopposite phase of their "life cycles." These sectors are coming off long-term bear markets, and he says they're poised for explosive gains...
Eric has detailed six specific opportunities that he expects to soar by 500% to 700%. It's the same system that helped him identify and lock in a 721% gain on Teck Resources (TECK) to beat out billionaire hedge fund managers like David Einhorn, Leon Cooperman, and Mario Gabelli.
To get more details on the six trades he's watching right now, and to learn how he pinpoints opportunities in the early stages of major upside moves,click here.