Despite the insane amount of volatility over the past couple weeks, I (Jeff Havenstein) am here to tell you not to panic.
In fact, I'm going to tell you that today's market sell-off is actually a terrific buying opportunity.
Now, that might sound a little freighting...
After all, the tech-heavy Nasdaq is in free fall. As I write, it's plunged by about 15% from its November peak. And the S&P 500 Index is now officially in a correction, around 10% since early January.
It makes sense why stocks have fallen…
There's record inflation and rising interest rates, which tend to weigh on growth stocks. Plus, we were just overdue for a market pullback. Stocks have soared since March of 2020 and valuations were stretched.
But today, I don't think you should give in to fear and follow the herd by selling.
Many of the indicators I'm watching tell me that this is just going to be a bump in the road in an otherwise healthy bull market.
I'll start by showing two charts that Doc Eifrig shared with his Advanced Options subscribers on Monday. They show that bearishness is at an extreme right now. And anytime we see the vast majority of investors doing one thing, the opposite tends to happen.
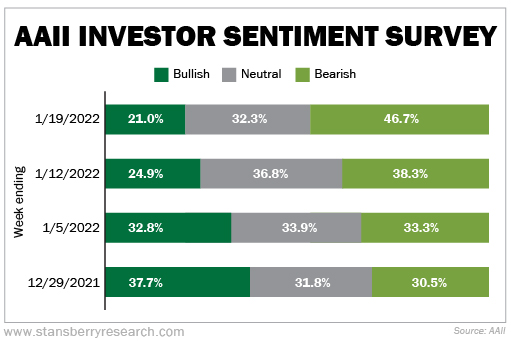
The first chart is from the American Association of Individual Investors ("AAII").
Since 1987, AAII members have been answering the same simple question each week: What direction do you feel the stock market will be in the next six months? The results are compiled into the AAII Investor Sentiment Survey.
Historically, members are pretty evenly split between feeling bullish, neutral, and bearish – though they've been more bullish than not. Over the past few weeks, however, AAII members have been overwhelmingly bearish. Take a look...

These latest survey results are the most bearish we've seen in the past 12 months.
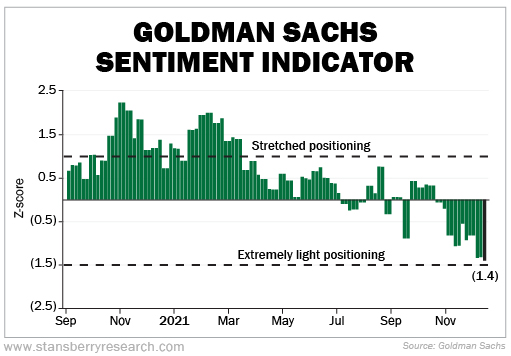
The second chart we want you to look at is the Goldman Sachs Sentiment Indicator. This measures how far stock prices are outpacing fundamentals. Today, it's at an extreme low...

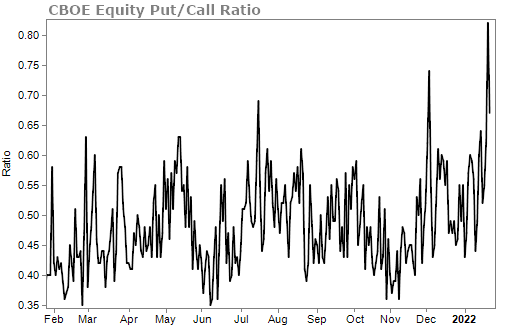
Finally, I wanted to share another measure called the "put/call" ratio. You can use this as a sentiment gauge.
When folks are fearful of market drops, they often purchase put options for protection. And when folks are bullish and want to bet on stocks rising, they buy call options.
By looking at the number of puts versus calls that traders are buying, you can gauge general market sentiment. The more optimistic traders get, the more the put/call ratio falls. And the more pessimistic traders are, the more the ratio rises.
Extreme highs in the ratio often make for good opportunities to buy stocks. Today, we're seeing the put/call ratio at a 12-month high...

Again, anytime we see the vast majority of investors doing one thing, the opposite tends to happen. So while investors are fearful and bracing for more volatility, it's likely stocks will rebound.
I think today is a great opportunity to "buy the dip" and scoop up shares of your favorite stocks. Of course, stocks could fall a bit further from here... but it's still an excellent entry point.
The truth is that market corrections happen... They're just normal parts of market cycles.
While it's never easy to try and buy when there's panic, finding that courage to buy often leads folks to make a lot of money.
But I understand that lots of people are worried right now...
Tomorrow night, Doc – along with Dr. Steve Sjuggerud and Matt Weinschenk – is stepping forward with the most important investment recommendation you will see from Stansberry Research all year. They'll discuss what we're seeing in the markets this year, what 2022 could mean for your money, and they'll each give away their No. 1 pick for the year.
What We're Reading...
- Something different: American Express plays down Omicron impact as spending hits record levels.
Here's to our health, wealth, and a great retirement,
Jeff Havenstein with Dr. David Eifrig
January 26, 2022
