Doc's note: As the COVID-19 pandemic continues to bear down on the U.S., lots of folks are worried about their portfolios. In today's issue, Dr. Steve Sjuggerud shares a major indicator that just started flashing a green light...

Are you worried about stocks?
Let me be more specific... Are you worried about another crash? Are you worried about whether it's safe to get back in?
If that sounds like you, I have good news, my friend. History is giving us a clear sign of this right now.
It comes from one of the most powerful bear market indicators we have... And this indicator is giving the stock market a green light.
Let me explain...
So what is this bear market indicator?
It's a little-known measure called the advance/decline line. This tells us how many stocks are moving higher versus the number of stocks moving lower.
The technical term for this kind of indicator is "market breadth." It tells us if, overall, most stocks are moving in the same direction or not.
A healthy market is one with lots of stocks moving higher. We want to see all sectors and company sizes booming... not just the biggest and most important companies in the major indexes.
That's exactly what the advance/decline line does. While it might sound fancy, it's a simple indicator.
Each day, you take the number of stocks that went up, then subtract the number of stocks that went down that day. Easy. You then add that number to the previous day's value for a running total.
That makes the advance/decline line a cumulative history of stocks going up or down. And it means that in a healthy market, this line will hit new highs alongside – or even before – the major indexes.
Again, by that measure, this bear market indicator is giving us the green light today. Take a look...
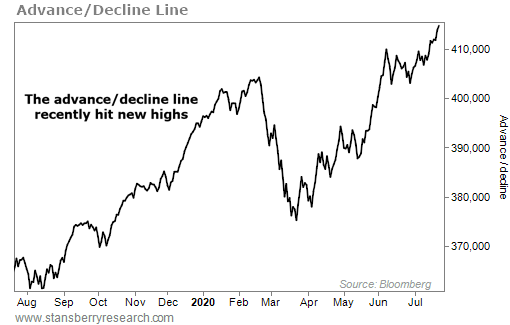
The S&P 500 Index hasn't quite hit new all-time highs. But the advance/decline line – which covers more stocks than the S&P 500 – hit a new high on June 5.
That was even ahead of the Nasdaq, which first hit a new all-time high on June 8.
This is exactly what we want to see. When the advance/decline line is hitting new highs ahead of the market, it means the rally is broad and healthy. It tells us that a bust isn't likely.
Now, it's worth noting that this indicator didn't flash a warning ahead of the COVID-19 crash. But that was a true black swan event. It wasn't caused by a crack in the underlying economy or the health of the market.
When those underlying issues are present, the advance/decline line is a perfect and simple way to see the problems with the bull market's health. It gave plenty of warning ahead of the dot-com bust and the Great Recession crash, for example.
The chart below shows the advance/decline line during the late 1990s. In that case, it peaked years ahead of the overall market. Take a look...
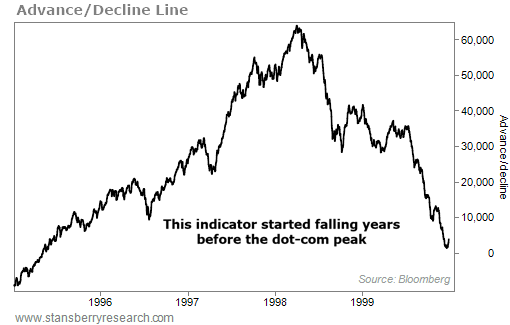
During the craziest part of the dot-com boom, very few stocks were driving the rally higher.
The advance/decline line peaked in early 1998. And by the time the stock market peaked in 2000, it had fallen to multiyear lows. Again, most stocks were falling... but the biggest and most important stocks were pushing the index higher.
That's the definition of an unhealthy market. And when you see it in real time, it means a bust is a near certainty.
Not surprisingly, the same thing happened during the housing bust. This indicator peaked in mid-2007. And when the market made its final peak a few months later in October, the advance/decline line didn't follow suit.
Simply put, this is an incredibly powerful bear market indicator with an impressive track record. And despite how scary things might seem out there today, it's giving this new bull market a green light.
I know what you're thinking, though: "What if we see a repeat of the 'black swan' crash of February and March?"
It's true – it could happen. But the first crash happened because the virus took the market by surprise. Now, the market is looking forward. It has digested the fears.
All kinds of stocks are moving higher. The rally is broad and healthy. And that means it can continue higher. Stay long.
Good investing,
Steve
Editor's note: Even with the market flashing a green light, we can't predict how long it will last. As we've told Health & Wealth Bulletin readers for years, always be prepared for the worst. That's why we hope you'll tune in this Thursday for a special presentation with Stansberry Research founder, Porter Stansberry. Porter will reveal what he thinks is going to happen next, how you can prepare, and even potentially make thousands of percent gains from it. Click here to learn more.