Doc's note: Today, I'm sharing a special guest essay from my colleague and Ten Stock Trader editor Greg Diamond.
Greg says that while he's still bullish on the market, he's seeing a big warning sign... According to Greg, the price action of two well-known stocks (which he originally detailed in his November 8 Weekly Market Outlook) could signal the end of the bull market...
***
A few months ago, I attended the annual Stansberry Research Conference in Las Vegas. It was nice to interact with other humans for the first time in a while.
During the conference, one subscriber in particular stood out to me...
He thanked me for a book I recommended a long time ago – Intermarket Analysis: Profiting from Global Market Relationships by John Murphy. He said it really changed the way he looked at markets and how they interact with one another.
Intermarket Analysis is a great read that dives into how markets behave. And most important, it explores the warnings that pop up at the end of big moves. You see, based on history, I'm noticing the same price action that usually marks the end of a bull market.
So today, I want to cover what you should keep in mind as we see stocks rocketing to new highs...
In my Ten Stock Trader service, I identify strong short-term trading opportunities for my subscribers through "technical analysis" – a strategy that relies on studying past market and human behavior to predict what's next.
Today, I'm going to show you how to use this tool to analyze two big stocks – construction giant Caterpillar (CAT) and tech leader Microsoft (MSFT).
These stocks represent different sectors of the economy. When they're rallying together, it's a sign of strength. When they're not, it's usually a warning.
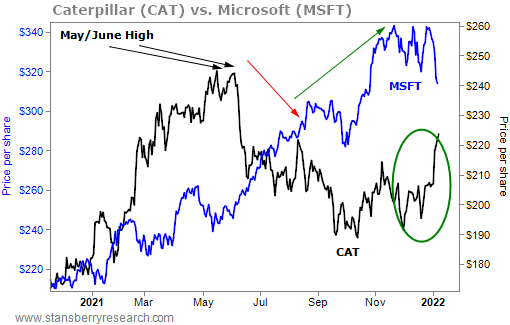
Right now, we're seeing a very wide divergence...
Caterpillar has failed to achieve new highs after topping out in May and June 2021, while Microsoft has soared to new highs lately. Notice the green circle on Caterpillar as it attempted to make a rally recently...
Now, look at this chart of the price action for Caterpillar and Microsoft from 1999 to 2000...
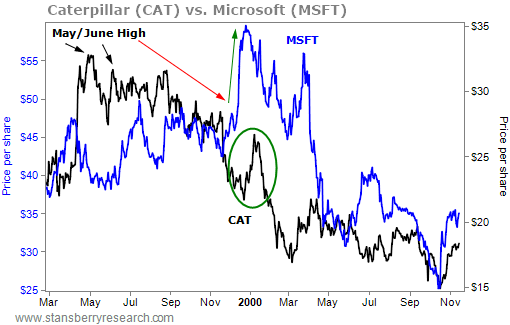
The price action in the first half of the chart is almost identical... Caterpillar topped out in May and June 1999 and traded down, while Microsoft skyrocketed to new highs (just like it's doing right now). Note the green circle on Caterpillar back then, too. It's the exact same price action as now – an attempt to rally that failed.
Ultimately, as you can see above, this wide divergence between Caterpillar and Microsoft preceded a massive crash and big bear market.
The price action in the Nasdaq 100 from 1998 to 2000 is also still very much in sync with the price action from 2020 to the end of 2021.
When I compare what happened between Caterpillar and Microsoft back then and now, it gives me more evidence that history is indeed repeating...
All is not well with the stock market.
If this analog continues, I'm expecting this bull market to end by February or March 2022.
That's a bold prediction, I know. But let me explain further...
This analog has been on point for more than a year now, so there's no reason for me to doubt it. I say it often to my Ten Stock Trader subscribers – be unbiased and let the price action guide you.
Right now, that price action is repeating in an unbelievable fashion. Again, look at the two charts above side by side... and really ask yourself if you can ignore it.
I can't.
It's incredibly important to recognize that stocks like Caterpillar and Microsoft are acting in the exact same way today as they did from 1999 to 2000. Again, this is more evidence that history is repeating.
So prove me wrong, Mr. Market... But for now, I'll respect your history.
Good trading,
Greg Diamond, CMT
Editor's note: Last week, Greg unveiled his biggest prediction of the year... He's warning of a major move that could either cause you serious losses (if you're not prepared) or help you realistically double your money 10 different times.