Doc's note: Today, I'm sharing a brand-new way for you to look at the stock market. It's a concept that most folks think is reserved for trading "pros." But in today's issue, Ten Stock Trader editor Greg Diamond explains how anyone can use this strategy to make money in any kind of market...
I'll be honest... It took me a while to grasp technical analysis, too.
But time and time again, I've witnessed the incredible power of understanding what's happening now... just like my former boss told me.
One of my goals at Ten Stock Trader is to educate subscribers on this incredible value.
I want you to see much more than the trendlines and patterns and understand that we are studying the behavior of market participants... We are learning from history.
There's nothing wrong with wanting to know WHY a certain stock will move... But I'm much more concerned with WHEN that stock will move and WHAT the price will do (i.e., how much it will go up or down).
And think about what really matters in investing – WHEN you buy and WHEN you sell. The WHY is less important when it comes down to the goal of investing...
Did you make or lose money?
That's all that matters.
Perhaps the greatest value technical analysis provides is that it's both a trading strategy and a risk-management system wrapped into one.
Today, I'll explain this strategy and system in more detail... I'm highlighting several of my favorite technical indicators and patterns that I use often in Ten Stock Trader.
This is most likely a brand-new way to look at the market for most people, so it's going to take some time to get used to. But once you understand the basics, I promise you'll begin to see the market in an entirely new way.
Let's get started...
First up is "price divergence"...
I look for price divergence across major indexes. This is a common focus in my weekly updates and in my live feed. When one index makes a new cycle low (or high) while another doesn't, this creates divergence.
That's usually a sign of a reversal on the horizon. It can be tricky to spot this pattern, but it's a valuable analysis to understand. A massive divergence occurred just before the crash in February. Take a look...
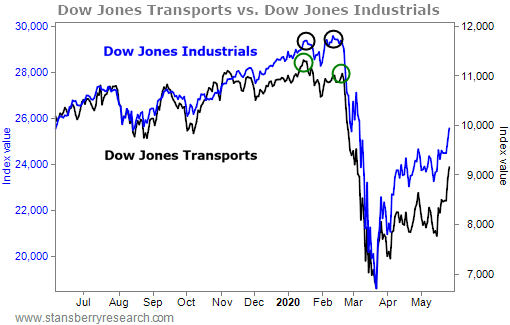
Notice the divergence between the Dow Jones Transportation Average in black and the Dow Jones Industrial Average in blue. The green circles marked a lower high in the Transports' price, while the black circles marked a higher high in the Industrials' price... setting up the divergence.
Obviously, this is an extreme example considering the massive crash that happened in the markets because of COVID-19. But such a big divergence provided a big warning that something was wrong – the two indexes were not in sync. There won't always be a big crash that follows a divergence like this, but when important indexes like the two above start to diverge, you can bet that a round of volatility is coming.
Next up, let's look at "moving averages"...
Moving averages are constructed by taking an average of a time series over a given period. The 50-, 100-, and 200-day moving averages ("DMA") are widely followed to determine support and resistance points.
Many trading systems are geared around these averages in some capacity.
Now, let's talk about "price symmetry"...
The market tends to trade in equal legs or movements, especially in corrective patterns.
Specifically in a bull market, a correction usually has three legs, where the length of the first leg is equal to the third leg. Here is a perfect example of price symmetry from the S&P 500 Index in 2017...
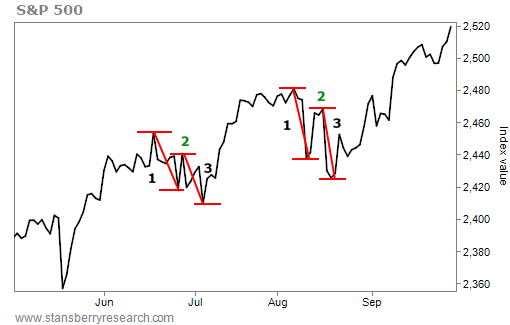
Notice the first leg in each pattern is about the same size as the third leg. Also note how after each third leg was complete, the market rallied.
Spotting price symmetry is important.
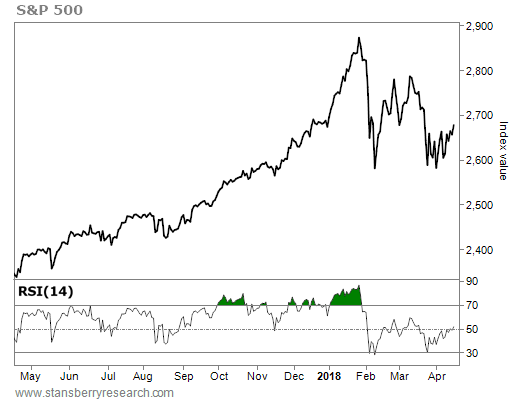
Next, we look at the relative strength index ("RSI"), which measures the momentum of a stock's price. It uses a scale from 0 to 100. A reading of 30 tends to be at or near oversold levels, and a reading of 70 tends to be at or approaching overbought levels.
You can see the RSI for the S&P 500 in the chart below. Notice at the bottom how it hit 30 in 2018. And then, prices rallied...
Similar to price divergence is "RSI divergence"...
This metric looks for differences between the price of an asset and its RSI level. This can signal buyers losing momentum on the upside, or sellers losing momentum on the downside...
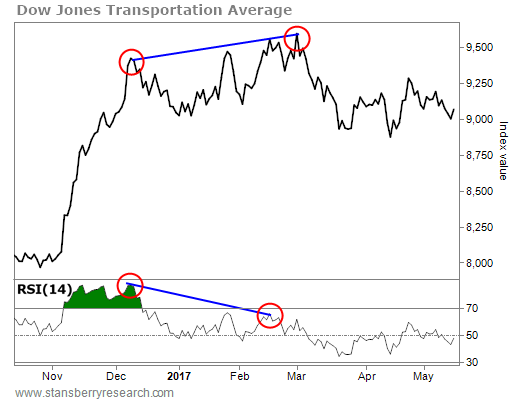
Look at the circled points on both the chart and the RSI indicator in the bottom panel. Do you see how the trend in price is rising while the same points on the RSI are declining?
This is divergence – and it was a warning sign of buyers losing momentum. You can see prices fell for another two months in 2017 after this signal triggered.
One of my favorite trading strategies is "ratio analysis"...
I'm constantly looking for the biggest trends at play as they relate to other asset classes or sectors of the stock market.
As a trader, I want to own what goes up... and sell short what goes down. Within the domestic equity markets, certain sectors behave differently given the current environment. Sector ratio analysis cuts through the weeds of individual companies and graphically shows what sectors are outperforming the overall market.
Take a look at the Technology Select Sector SPDR Fund (XLK) versus the iShares U.S. Real Estate Fund (IYR) from a few years ago...
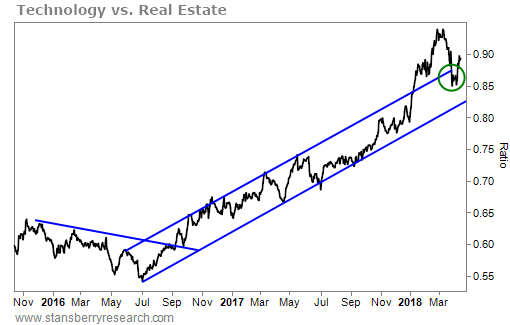
This chart reveals that buying XLK and selling short IYR would be a great trade.
Another example of ratio analysis is used on different asset classes...
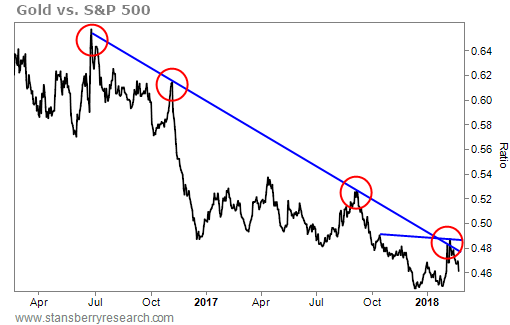
This chart shows what would have happened if you bought gold and sold stocks a few years ago. In other words, you would have lost a fortune.
This is ratio analysis at its best. It signals the best trends relative to other asset classes to allocate to your portfolio – and more important, the assets or sectors to avoid.
This type of analysis is also fantastic at signaling a change in correlations between asset classes – a critical component to understanding major shifts in economic trends.
One of the biggest aspects of technical analysis that gets overlooked is time...
The history of the market repeats, usually in cycles. Finding those cycles can be difficult, but using time as a roadmap for what to expect is critical for successful investing.
I've spent more than 16 years studying the history of the market and extrapolating the data to better understand when to expect a market move. The key is to understand the larger cycle in play and then use the shorter cycles to identify turning points within each month.
It's not an exact science... But by combining technical indicators above with the time-cycle analysis can be a very powerful combination...
I can sum up my approach to trading with a quote from one of the most successful hedge-fund managers alive...
Famed investor Stanley Druckenmiller once said diversification is a dirty word. "Put all your eggs in one basket and watch the basket very carefully," he said.
That quote profoundly changed my thinking on investing and portfolio management.
I want to emphasize how important this idea is... that being too diversified and having too many baskets with too many eggs in them can wreak havoc on performance.
In my experience, more positions means more problems. That's why I'll only recommend a maximum of 10 positions at any one time in Ten Stock Trader. This allows me to use all of my energy and attention on a limited number of positions, and it keeps things simple.
Now, I saved the most important piece for last... position sizing and risk management.
The instructions for each trade in Ten Stock Trader are based on a percentage of your portfolio... For example, if I say buy a 1% position in XYZ stock and you have allocated $100,000 to Ten Stock Trader, then you would buy $1,000 worth of XYZ stock for that trade.
I will always indicate the percentage allocation on every trade. It's up to you whether you want to allocate more or less, but I like to look out for novice traders.
I want you to see how the pros trade... Hit singles and doubles first, while learning the strategies and the right way to trade. Then, if you want to trade bigger, you can.
Some folks have a higher risk appetite, more capital to work with, more experience, or a combination of all three... so they can trade bigger than my position-size recommendations.
But I'll always recommend what someone just starting out should do. It's the right thing to do. It's what I would want if I were in your shoes.
Never risk your entire portfolio on one trade. Ever. Period. This is the No. 1 reason why investors go broke.
I hope I've helped you get a solid foundation into learning how to trade like the hedge funds do. And I'd love for you to join me at Ten Stock Trader.
Regards,
Greg Diamond
Editor's note: Greg predicts something big is coming on May 10. This event could either wipe you out... or propel you forward to spectacular gains – if you know how to take advantage of it. Click here to learn more.