"Things must really be bad. Even Doc's finally getting bearish."
I've heard similar comments from readers these past few weeks. They noticed a change in my writing. It's not surprising. I've earned a reputation for my optimism on this current bull market. But as I've said recently, I'm getting worried.
Today, we're continuing our series on understanding the current market with one of the key indicators of what's happening today... debt.
Investor optimism drives the market up, and fear brings it down. So we look at investor debt balances in margin accounts to give us a sense of what kinds of risks investors are taking.
For those who have never bought on margin before, you can think of it as a loan from your broker. It allows you to buy more stocks than you'd normally be able to. For example, put option sellers use a margin account to reduce the amount of capital they require up front. Instead of coming up with the full amount of capital to purchase 100 shares of stock, you'd only need a percentage of that... usually about 20%. And you would borrow the rest.
Margin is risky. When you buy securities on margin, you must repay the amount you borrowed as well as interest, even if you lose money on your investment.
When we see a run up in margin debt balances, we get nervous. That means more folks are buying with borrowed money, fueling valuations that aren't supported by what companies earn.
According to the Financial Industry Regulatory Authority (FINRA), investor margin debt hit an all-time high in May at nearly $669 billion. We're currently right below that high at $554 billion. Both numbers are well above any level through the past couple decades.
To get a fair picture over time, we like to consider margin debt against GDP. Even with that view, margin debt is just below an all-time high...
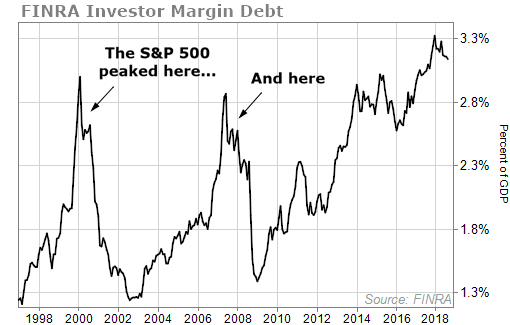
Each time the ratio has hit a fresh high over the past two decades, the stock market peaked shortly after.
And maybe more important, even if margin debt can't show you when the market will peak, it can help you understand how bad the downturn will be. When stocks bought with borrowed money fall, it leads to more selling and a faster, more brutal decline.
What we can see is that margin debt compared with GDP is just below an all-time high. Folks are taking on more risk. And history tells us that at these elevated levels, we should prepare for a market downturn.
It's not just stocks, though. Companies have also taken on more risk in the form of more debt. Right now, many companies have grown on borrowed funds.
Corporate debt has skyrocketed about 40% past its previous 2008 peak. That means businesses have tacked on over $2.5 trillion of debt in 10 years.
Again, factoring in GDP levels, corporate debt levels are very worrisome...
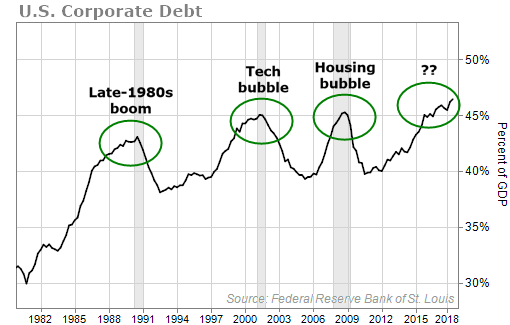
Corporate debt as a percent of GDP is now at an all-time high of 46.4%.
You could say the economy is so strong, investors and businesses can afford to take more risks. But the economy today could be as good as it gets...
Debt has to be paid back from earnings. And while earnings are up, they haven't grown that fast. If a recession surfaces – or even if growth just slows down – paying off debt will get harder. And when companies can't repay their principals or even pay the interest on their debt, things get ugly.
As for growth, it will be harder to come by, moving forward. The economy is operating at near-peak capacity. You can measure this with "potential GDP," a measure of what the economy would produce if all its assets were put to productive use.
Over the past few years, GDP was below its potential, which signaled there was room for our economy to grow. But this year, the gap between potential and actual output closed.
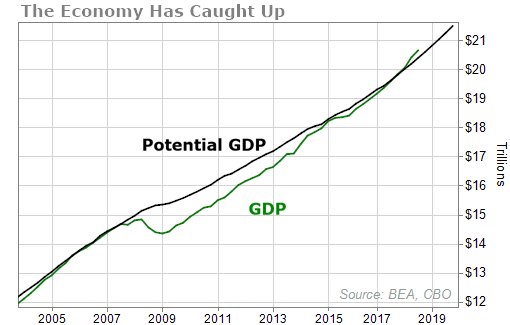
Actual GDP is now greater than potential GDP. That leaves little upside to grow. The last time actual GDP exceeded potential output was right before the Great Recession of 2008.
Finally, we have to talk about valuation... Just a few months ago, the S&P 500 traded for about 20 times earnings. Stocks have only been that expensive 20% of the time in the past 64 years... That puts us in the final two bars on the following chart...
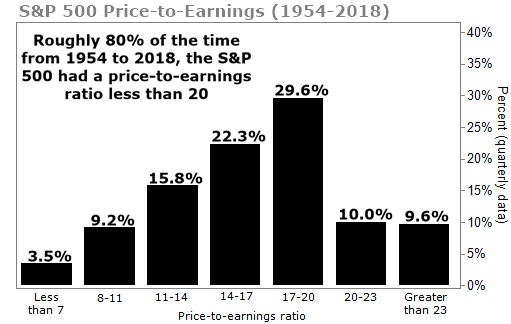
But the market sold off toward the end of 2018. The S&P 500 trades for about 18 times earnings today. About 30% of the time, the market has a price-to-earnings ratio between 17 and 20, so we can feel a little better about today's valuation. Still, the market is trading above its historic average.
The point is, there's a lot of risk in the market. And we think it's time to pare back the risk in our portfolios and find safer sources of income.
And if you want to learn more about how to do exactly that, make sure you tune into my Urgent Market Briefing TONIGHT at 8 p.m. Eastern time.
I'll detail warning signs I'm seeing in the market and how to protect your wealth in a downturn.
Click here to reserve your spot.
Here's to our health, wealth, and a great retirement,
Dr. David Eifrig and the Health & Wealth Bulletin Research Team
January 23, 2019