Doc's note: You can't time the market, but there are early warning signs before things start to get bad. In today's issue, Dr. Steve Sjuggerud shares an important early warning indicator that tells him when to start worrying...
If you're worried right now, make sure you tune in this Wednesday at 8 p.m. Eastern time. Steve will detail how to make a profit in the final months of the bull market, when he's expecting the next bear market to hit, and his No. 1 investment to get into right now.
Click here to reserve your spot.

It doesn't take a rocket scientist to know when stocks are likely to crash.
You just have to look at the right indicators... And ignore the wrong ones.
I've been bullish on stocks for years. And I've continually told folks to stay long, despite plenty of fears in the market.
I haven't changed my tune, because the most important market indicators haven't been flashing warning signs.
Today, I'll share yet another "early warning" indicator...
Stocks tend to crash when this indicator enters dangerous territory. It's another way to know when we have the "all clear" to make money in stocks. And right now, it's telling us something important.
Let me explain...
Regular DailyWealth readers know I've been tracking a number of "early warning" indicators that will tell me when to start worrying about the end of the stock market boom and the arrival of the next recession.
We've checked in on some of them before in DailyWealth, like the advance/decline line and the performance of small-cap stocks.
Simply put, these indicators are not worrying me yet. They're still giving us the "all clear" to stay long.
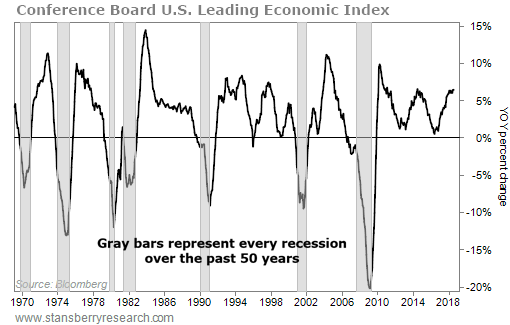
I'd like to share yet another simple indicator with you... one that has predicted every recession of the past 50 years.
I'm talking about the Leading Economic Index (LEI) from an independent research group called The Conference Board.
The Conference Board's LEI for the U.S. looks at 10 different economic indicators... everything from employment, to housing, to interest rates.
Importantly, this indicator has an incredible track record of predicting recessions. As you can see on the chart below, every recession of the past 50 years happened after the year-over-year percentage change in the LEI went negative...

Again, the chart shows the year-over-year change of the LEI index. And when that goes negative, look out.
Right now, this index is showing the economy is healthy. We're nowhere near zero today... let alone going negative, like the index tends to do before a recession.
Stocks tend to suffer their worst declines during recessions. So the fact that there's no recession in sight gives us a powerful takeaway – when you look at the indicators that have a good track record as early warning signs, it's NOT time to worry yet.
We haven't even started seeing the telltale signs of a market peak, where the big gains are concentrated in just a few names and everyone is talking about stocks.
My "Melt Up" thesis is still in place. I still expect stocks to soar dramatically over the next 12-18 months. Certain sectors could see triple-digit returns as this bull market enters its final innings.
Instead of worrying like everyone else, you need to take advantage while everyone is timid. You need to own stocks right now.
Good investing,
Steve
