Doc's note: Every Monday, for the next three weeks, I'm featuring an essay series from my colleague Ben Morris, editor of DailyWealth Trader.
Ben recently explored the relationship between the U.S. dollar and commodities, which commodities are due for a rise, and what company is likely to benefit most.
In today's essay, Ben explains why the relationship between the dollar and commodities is breaking down.
There are two sides to every price...
When most folks think about the price of something, they simply think about its cost in their home currency. A book costs $10... Or a bottle of wine costs $30.
In day-to-day life, that line of thinking is fine. But it's only one side of the picture. When you're looking at the prices of international assets, it's useful to look at both sides...
On one side of a price, you have the asset being measured. That's the barrel of oil or the ounce of gold. On the other side, you have your "measuring unit." This is the currency you're measuring the first side with... like dollars, euros, or yen.
To understand what's really happening when these asset prices move, you need to understand what's happening on both sides.
For example, let's say you notice that over the past week, the price of gold (in U.S. dollars) has risen. The next question you should ask is, "What was going on with the dollar?"
You see, when the dollar falls relative to other global currencies, the number of dollars it takes to buy an ounce of gold rises. The price of gold in euros and yen may not have changed at all... But because the dollar fell, folks in the U.S. see the price of gold rising.
The same holds true for other international assets, like the ones in the Bloomberg Commodity Index...
The Bloomberg Commodity Index tracks a basket of about 20 commodities that are produced and traded around the world. Nearly 50% of its current holdings are in (futures contracts for) crude oil, gold, copper, corn, and natural gas.
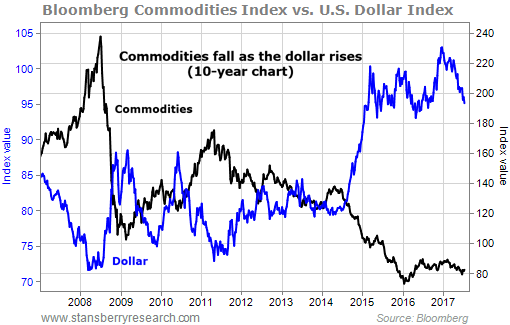
For most of the past 10 years, the dollar has been a strong enough force to dictate the direction of the Bloomberg Commodity Index. As you can see in the chart below, when the dollar (the blue line) rose, commodity prices (the black line) dropped. And when the dollar dropped, commodity prices rose...
As I noted above, this inverse relationship has some logic to support it...
But that's not always the case. Some of the best periods for commodities have come at times when the dollar was rising, too...
For example, from July 1995 to May 1997, the Bloomberg Commodity Index climbed 36% and the U.S. Dollar Index climbed 16%. This was a time during which the normal inverse relationship "wasn't working."
Interestingly, though, the inverse relationship broke down before these big moves higher. In the year prior, the commodity index slid 3% while the dollar was down
10%.
I mention this now because the relationship has broken down again. Over the past year, commodities are down 4% while the dollar is down 2%. The two have traded in the same direction for a lot of that time.
This could be a sign that commodities are now trading on their own accord... rather than being tied so much to the dollar. If that trend continues, we can worry less about what the dollar is doing and focus more on what's happening with individual commodities...
Next week, I'll tell you about a commodity that's hitting a multiyear low... and why it could start to rise.
Good investing,
Ben Morris
Doc's P.S. Every weekday in DailyWealth Trader, Ben shares his favorite ideas and recommendations from across the markets. Some of these ideas will come from the best analysts at Stansberry Research... from the market's greatest money managers... and from his extensive network of contacts and industry "insiders." Click here to learn more.
[optin_form id="73"]