Editor's note: When all hell breaks loose, you need to be prepared...
Whether you think an economic collapse is near or the current bull market still has room to run, that's the one thing everyone should be... prepared.
Unless you own something that holds value through chaotic times, you could find yourself much poorer. Holding metals like gold and silver makes sense in times like this. They have intrinsic value, and they can't be created on a whim... There's only so much gold and silver to go around. That's why I call them "chaos hedges."
According to Stansberry Resource Report analyst Brian Weepie, now is one of the best times in eight years to buy silver... In today's issue, Brian explains why you should think about adding silver to your portfolio.
***
Interest in gold is heating up. But nobody is paying attention to its cheaper cousin, silver.
Over the last three months, nearly $6 billion has flowed into the largest gold exchange-traded fund ("ETF") – the SPDR Gold Shares Fund (GLD). Meanwhile, money has flowed out of the largest silver ETF, the iShares Silver Trust (SLV).
Investors are pushing to buy gold... but they're still not interested in buying silver. As I'll explain in today's essay, the people ignoring silver are making a big mistake...
Since 1990, the average gold-to-silver ratio has been 66. In other words, over the last 26 years, you could buy an average of 66 ounces of silver with one ounce of gold.
But the ratio has gone haywire lately. As you can see from the chart below, the gold-to-silver ratio recently hit 80...
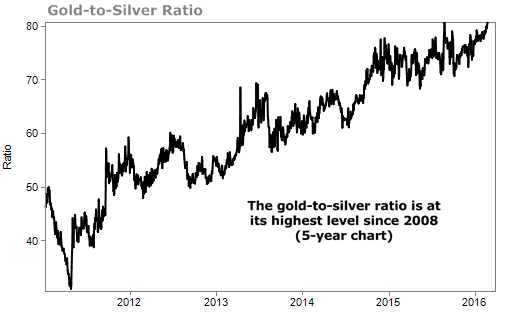
Reaching this level is rare... It has only happened four times since 1996. Today, the ratio is above 80 for the first time since October 2008.
In the months and years that followed, the price of silver outperformed the price of gold. Over six months, silver beat gold by nearly six times. Over a three-year period, silver more than doubled gold's returns...
| Period | Gold Return | Silver Return |
| 1 month | -13.1% | -3.6% |
| 6 months | 2.8% | 16.3% |
| 1 year | 22.1% | 66.9% |
| 2 years | 56.0% | 118% |
| 3 years | 95.3% | 202.7% |
Prior to October 2008, the ratio hadn't eclipsed 80 since May 2003. Again, silver topped gold over both the short and long term. Two years later, silver prices had outperformed gold prices by more than four times...
| Period | Gold Return | Silver Return |
| 1 month | -6.8% | -1.2% |
| 6 months | 7.4% | 17.6% |
| 1 year | 6.5% | 33.6% |
| 2 years | 13.9% | 59.8% |
| 3 years | 77.3% | 178.3% |
Before May 2003, the ratio hadn't hit 80 since November 1996. Gold prices quickly sunk, but silver prices rose slightly over the months and years that followed...
| Period | Gold Return | Silver Return |
| 1 month | -2.1% | 2% |
| 6 months | -9.8% | 0.4% |
| 1 year | -17.3% | 3.9% |
| 2 years | -22.4% | 6.3% |
| 3 years | -23.2% | 7.9% |
The last three times the gold-to-silver ratio reached today's levels, silver generated positive returns over the next year or two. It's realistic to think that will happen again today.
Today, gold and silver trade for around $1,255 and $15.15 an ounce, respectively. If the gold-to-silver ratio simply returns to its average of 66, silver would be worth around $19 an ounce – a 25% gain from here.
If you're looking to buy precious metals today, history suggests silver is your best bet.
Good investing,
Brian Weepie
P.S. Each month in Stansberry Resource Report, editor – and expert geologist – Matt Badiali looks at the best natural resource investments today. In his most recent issue, Matt updated readers on some of his favorite ways to invest in precious metals. Click here to learn more about Stansberry Resource Report.