The S&P 500 Index is generally viewed as a proxy for the U.S. economy. But don't let that fool you...
The index isn't what it used to be.
Today, there are just a handful of companies that make up the majority of the S&P 500.
I (Jeff Havenstein) am talking about the "FAAMG" stocks. This group of companies includes Meta Platforms (FB), Apple (AAPL), Amazon (AMZN), Microsoft (MSFT), and Alphabet (GOOGL).
Together, these five companies make up 22.3% of the S&P 500. If you throw in Tesla (TSLA), worth $1.1 trillion, they make up one-fourth of the index.
So while the S&P 500 is supposed to represent the market broadly, a lot of its movement is directly correlated with these big tech giants.
Other smaller companies could be struggling, and their stocks could be falling, but if these six tech giants are rising, the index might be up. That's why it's often challenging to know if this bull market is actually healthy or if it's just being propped up by a few companies.
One way to gauge this is by looking at the at the "advance/decline" line for the S&P 500.
The advance/decline line is a simple measure... You take the number of stocks that went up in a given day and subtract the number that went down. If more went up that day, the line goes up. If more went down, the line goes down.
In a typical bull market, as the market goes up, the advance/decline line goes up, too.
When the advance/decline line moves lower while the market continues to go up, then it's time to worry. It means the gains are concentrated among only a few companies.
That's exactly what happened in the late 1990s. And as you know, the dot-com bubble burst shortly after.
Today's advance/decline line looks nothing like the late 1990s.
The market is up, and so is the advance/decline line. This metric tells us this bull market is still healthy...
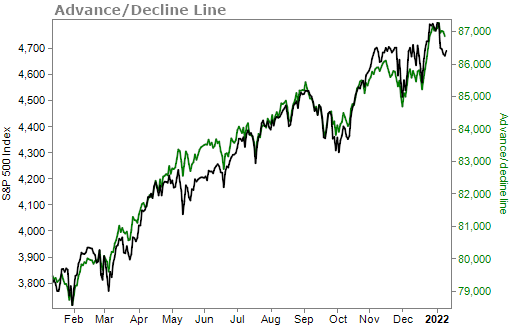
You can even see that the S&P 500 has fallen in recent days while the advance/decline is up near all-time highs. This is a buying signal.
In short, the advance/decline line is a simple but effective tool. And today, it's telling us that stocks can still climb higher.
Despite all the concerns there are to bring this bull market to a halt – everything from inflation to record stock valuations – my best advice is to stay long.
Plus, given the volatility over the past week or so, there are a lot of good deals in the market today.
There are blue-chip, world-dominating companies that are on a dip and ripe for a rebound. Take Microsoft, for example.
Pretty much anytime over the past few years has been a great time to buy shares. Today they are down about 10% from their recent high.
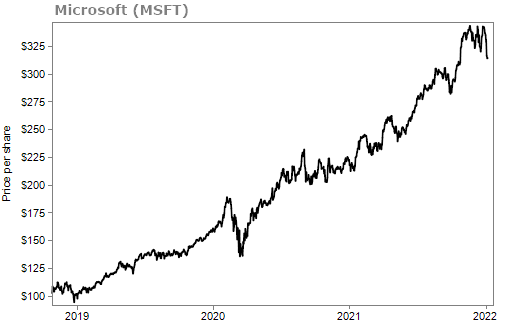
The growth story for Microsoft is far from over. Microsoft still has plenty of upside left thanks to its cloud-computing platform, Azure.
If you don't already own a company like Microsoft, now is a good time. Or you could add to an existing position as long as you use proper position sizing.
In general, the markets can still go higher this year. You want to put yourself in a position to be along for the ride.
If you want to know exactly how to do that, don't miss my colleague unveiling his biggest prediction of the year tomorrow night.
He's warning of a major move that could either cause you serious losses (if you're not prepared) or help you realistically double your money 10 different times.
Click here for all the details.
What We're Reading...
- S&P 500 companies by weight.
- Goldman's David Kostin says a tech disconnect is the 'single greatest mispricing' in U.S. stocks.
- Something different: Man gets genetically modified pig heart in world-first transplant.
Here's to our health, wealth, and a great retirement,
Jeff Havenstein with Dr. David Eifrig
January 12, 2022