Doc's note: Cash is an important part of anyone's wealth plan. While it's true that you want your money to work for you, you should always have cash on hand for emergencies.
Today, Vic Lederman – editorial director of our corporate affiliate Chaikin Analytics – explains why investors put their money "under the mattress." In this issue, published last month in Chaikin PowerFeed, Vic shares what investors' cash balances mean for the overall market...
![]()
It's good to have some cash lying around for a rainy day...
Life is unpredictable. One day, everything is fine. But then... a curveball comes along.
You could lose your job, get sick with a debilitating illness, or become a victim of identity theft.
Sure, you could file for unemployment benefits when you're out of work. But the way prices of everything have been soaring, government assistance probably won't get you very far.
One bad illness or accident can land you deep in debt. And if you're lucky enough to have health insurance, high deductibles and rising insurance premiums will quickly drain your finances.
Having enough spare cash lying around can make these unpredictable situations easier to navigate and overcome. It's what a lot of older folks like to call "keeping cash under the mattress."
But how much cash do we put "under our mattress?" For most U.S. investors, that figure is usually 22% of investable assets.
That's according to the American Association of Individual Investors ("AAII"), which has conducted a survey of regular investors since 1987. The AAII also found out that, on average, investors place 16% of their money in bonds and 62% in stocks.
These allocations fluctuate depending on how bullish or bearish people feel about the economy...
For example, during the dot-com boom toward the end of 1999, people were particularly bullish. They had just 12% of their investable assets held in cash, while 76% was in stocks.
But when the bubble burst, a recession hit. And by the time unemployment peaked in 2003, investors were holding 38% of their funds in cash. That was more than triple their cash allocation before the crash.
During the depths of the financial crisis in 2009, investors were so fearful that they set aside 45% of their assets as cash. They cut their stock allocation to a mere 41%.
So today, how are individual investors feeling? Let's take a look at what their cash allocations are telling us...
Right now, investors are feeling particularly bullish. And it shows in their allocation of cash. Take a look at that compared with the S&P 500 Index...
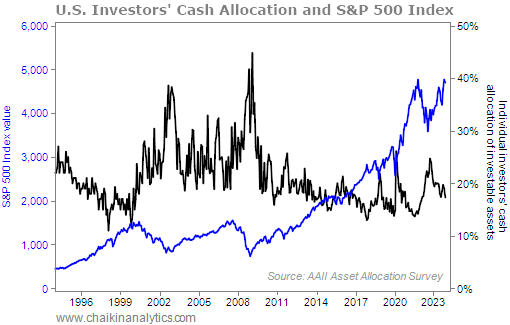
For all the talk about a coming recession, unemployment is near a 50-year low. U.S. gross domestic product ("GDP") grew an annualized 4.9% in the third quarter of 2023. And the S&P 500 is in a bull market that's just about 16 months old.
As a result, investors have allocated just 17% of their investable assets into cash. That's a drop from 25% during the market correction in October 2022. Meanwhile, their stock allocation has risen from 62% to 67%.
Even then, investors are far from being overly optimistic about stocks. That's because history shows that when investors are highly bullish, they're been willing to put more money to work in the stock market. And they're perfectly fine with holding less cash than they are today.
Indeed, as you can see in the chart above, the past three peaks in the market saw cash holdings among individual investors fall to less than 15%.
If the economy keeps performing well and unemployment stays low, folks will be comfortable taking more money "out of the mattress" and putting it to work instead.
Also keep in mind that this is an election year. Historically, these have proven to be positive for stocks. Dating back to 1937, the average gain for the S&P 500 during election years comes in at about 10%.
To put it all together, U.S. investors are still sitting on a good deal of cash in a year when they could be putting more to work in the markets.
This tells me that we likely haven't seen the peak of this current bull market. So I'm still bullish today.
Good investing,
Vic Lederman
Editor's note: According to my friend Marc Chaikin, an election year offers an incredible opportunity for those who understand how to time the election cycle and combine it with his Power Gauge system. In fact, this could be the best year for investing this decade.
Marc will unveil all the details this Thursday night. And when you reserve your spot now, you'll also get the names of three stocks that Marc believes are election "ticking time bombs."