I love talking to cabbies. Whenever I travel, I interview cab drivers to see how busy the airport and other parts of the city have been.
It's something I call my "Cabbie Index," and it has helped me get a good sense of how our economy is doing. And it's more than just drivers...
At the Retirement office in Baltimore, we're always watching for local construction sites (they keep popping up)... noting the number of cars in the parking lots of area malls (Target stores are full)... counting the empty seats on planes and trains (not many)... and keeping our ears open for what products are getting buzz (I'm not sharing until I buy and try them).
This can help you spot great opportunities in growing companies and give you a glimpse into what the economy is doing.
But you need to be careful when you apply your experience to the whole. And you always need to back it up with data.
What you see in your daily life depends on where you are... In the communities near our offices in Maryland, we benefit from the federal government adding stability to our job market. After the housing crisis and Great Recession, folks in Maryland and Virginia experienced a quicker recovery in employment and housing prices.
Others, like in Detroit, never saw jobs come back. And those outside Las Vegas still haven't seen housing prices return.
Your view of the economy will differ if you live in a manufacturing town compared with Silicon Valley. With a nation as varied as the United States, it's dangerous to extrapolate from what you see in any one spot in the country.
For complex issues, you need broader data from around the nation to guide you. And right now, we're seeing strength in U.S. employment numbers. It backs up our long-standing belief in America.
Over the past decade, many folks have seen growing income and gainful employment, but others still struggle. In many industries and parts of the country, there simply aren't enough jobs. In other areas, you just can't get ahead on the wages available.
When folks see that the unemployment rate is a low 4.9%, it may not jibe with what they see. They get suspicious. And when some find out that the headline unemployment number doesn't include folks who have given up looking for work, calling it some sort of conspiracy.
Please, don't let this skepticism invade your thinking.
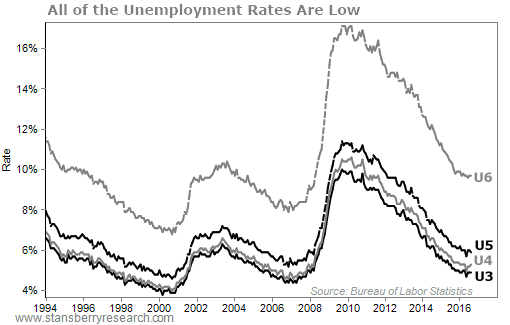
The standard unemployment statistic (called "U3") has always measured the percentage of people who have actively looked for work within the past four weeks but aren't working.
Yes, that number doesn't include people who've given up (called "discouraged workers"). But this is no conspiracy. You can find that number in all the same reports. It's known as the "U4." That's at 5.3%.
You can also look at other levels... like folks who work part time because they can't find full-time jobs. That's "U6," and as of September 2016, it's at 9.7%.
The variations go on... But they are all down from a year ago.
So much public data exist that you could even build your own unemployment rate if you'd like. If what matters to you is the unemployment rate in Orange County, California, you can see that it's 4.6%. If you're curious about women aged 55 and older, they have an unemployment rate of 3.4%.
You can dig deeper if you want to know how many employees work in different industries and areas. How many people have jobs in mining, logging, and construction in St. Louis, Missouri? 67,600.
When you look at different unemployment rates, some appear higher than others. But those rates at any single time tell you nothing. Instead, by looking over a period of time, you can see they are all improving.
As of September this year, the "headline" U3 unemployment number was 4.9%.
Again... a skeptic will say that "real" unemployment is much higher when you add in other groups. Well, we can see what happens when you add in discouraged workers (U4), people who "would like to work" but have given up (U5), and those who need to work part time (U6).
As I said, when you put them all together, that gets us to an unemployment rate of 9.7%... But remember, that number is always higher than U3 by definition. And 9.7% isn't particularly high for U6. It's much lower than the high-teens peak during the recession.
And we can see certain parts of the economy are thriving while others struggle. Let's switch to the growth in the number of people employed (rather than unemployed), so we can see what's really picking up...
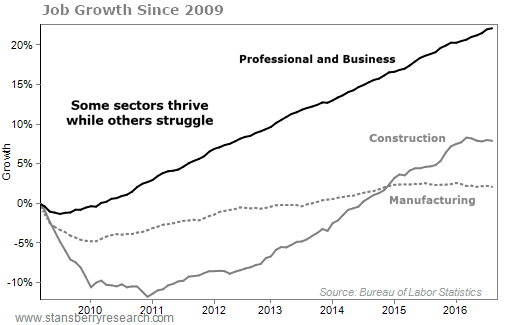
So we know the economy is doing well overall. We're adding about 200,000 jobs per month. And that's what brought us to an options trade in Retirement Trader. We recommended a trade on a company poised to profit from the surge in job growth.
If you haven't tried Retirement Trader yet, we're offering a great deal for new subscribers. You can start your 30-day trial right here.
What We're Reading...
- The economy has been solid for years, even when folks didn't believe me last fall.
- Investopedia breaks down what U6 measures.
- Something different: Aerospace engineers answer important questions... about Oreos.
Here's to our health, wealth, and a great retirement,
Dr. David Eifrig and the Retirement Millionaire Daily Research Team
November 2, 2016